Save as pdf
 |
|
Estimated Solar Analysis for: |
|
, this is your personalized solar system estimate for your () property, please let us know if you have any questions. Estimated base cost of system: () Estimated incentive on solar system installation*: () Federal Tax Credit: () Estimated cost of system after credit and incentives: () *Incentive is based on electric company, and first come first serve basis. Incentive programs typically run out during the Summer of each year. This is only an estimate based upon many assumptions. Installation costs can vary considerably. We encourage you to work with our professional team of solar experts who can provide you with a more detailed cost estimate. We estimate that a 15 kW peak DC power system will cost between $48,000 and $72,000. This estimate assumes the mid-point of this cost range. |
|
SAVINGS & BENEFITS |
|
These savings are calculated based on an average use of 2,000 kWh/mo at $0.1764 / kWh and inlclude credits. |
|
First-year Utility Savings: $3.983 Average Monthly Utility Savings: $557 Average Annual Utility Savings: $6,685 over 25-year expected life of system 25-year Utility Savings: $167,133 Levelized Cost of your Solar Energy: $0.07 / kWh $42,000 cost/ 571,700 kWh electricity replaced by solar |
|
Utility savings shown above do not take income tax effects into account (they use "Post-Tax" dollars). The financial ratios shown below are based upon the cash flow values shown in the Cash Flow table, below, which include income tax effects, as noted. |
|
Appreciation (Increase) in Property Value: Return on Investment (ROI): $79,660 Internal Rate of Return (IRR): 428% Net Present Value (NPV): 16.4% Profitability Index: $72,177 Greenhouse Gas (CO2) Saved: 469 tons (938,000 auto miles) over 25-year system life |
|
|
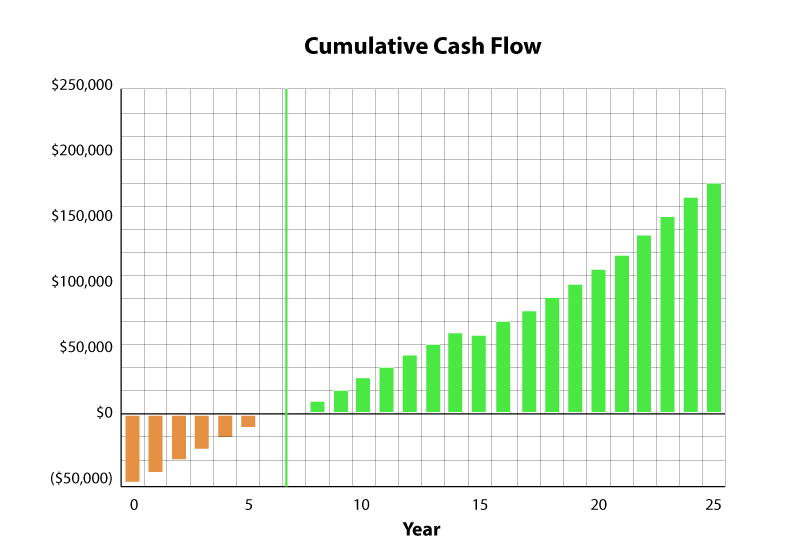
Cash Flow Breakeven is where the chart crosses the $0 point - this is when your investment has paid itself back in cash. The chart above is a summary of the net cash flow you can expect over time. Net Cash Flow is the total cash after all costs (out-flows of cash) are reduced by financial incentives, annual utility savings and tax effects (in-flows of cash). Average values are used together with your assumed income tax rate (28%). Any property appreciation has not been included, as this is generally not a cash flow (it's an investment) The loan modeled, if any, is included. Because individual tax situations vary, we have not included Federal income tax liabilities that may result from having received !!Q!l-federal incentives, if any (e.g. state rebate programs) as they are usually not taxed as earned income. |
|
Cash Flow by Year and Cumulative Across Years |
|
This cash flow table includes tax effects applied to utility savings and loan interest payments (if any). You have elected (above) to show utility savings in Pre-Tax (Gross Income) dollars ('pre-tax' or what you earned). Therefore for every dollar saved on utility bills, the pretax savings will be higher: Pre-tax Utility Savings= ( saved on utility bill)/ (1 - Income Tax Rate). You may also earn compounding interest tax free (not shown). Because individual tax situations vary, we have not included Federal income tax liabilities that may result from having received non-federal incentives, if any (e.g. state rebate programs) as they are usually not taxed as earned income. Any income from your system (e.g. performance-based incentives and 'SREC's') may be taxed as income (also not shown). |
Notes & Assumptions: Solar Electric (PV) Systems |
*HOW TO REDUCE THE SYSTEM SIZE NEEDED & INCREASE SAVINGS |
The estimate provided above assumes 'base' electric rates apply. Other taxes and surcharges may be applied to your utility bill. We suggest you review a recent utility bill and change the 'Assumed Electric Rate', above, as needed to better match your situation. You may have other metered-rate options with your utility. Options such as liered billing rates, lime-Of-Use (TOU) metering, and NetMetering, if available, can help reduce the system size. you need to provide a 'net-zero' energy bill. Sometimes people also reduce the size of their solar system to accommodate planned improvements in their building's energy efficiency, or to match a budget and/or the available space for installing a solar system. |
Energy production from a solar electric (PV) system is a function of several factors, including the following. Our assumptions are: |
1. Solar Availability 2. Clean, washed frequently system: 100% design sunlighttransmission 25C, calm wind 3. Non-battery System 4. South facing, tilted at latitude, full sun |
Energy Efficiency: Improving your building's energy efficiency will reduce the system size you need to attain a 'net-zero' energy bill. Tiered Rates: Often people are paying a 'lie red' rate for their electricity. This is a higher rate (higher than the 'Base' rate) for electricity charged when a home or building uses more that a 'Base' amount allocated for the building. Installing a solar system will reduce your electrical demand from the utility. This can result in a lower utility rate because you stay within the 'Base' rate level. In this case, the more expensive 'Tiered' rate electricity is eliminated, reducing your average electricity rate. |
TOU Metering: Many utilities offer lime-of-Use (TOU) meters. This allows the price of electricity to vary by time of day (called 'Peak' or 'Off-Peak' periods) and by season (usually ''Winter' versus 'Summer' rates). If TOU metering is offered by your utility, a solar system may result in additional savings. This is because peak (more expensive electricity) rates often occur during the daytime. This is usually when a solar system is producing the most output, thus reducing your demand for peak-rate electricity from the utility. Most utilities do charge for the purchase and installation of a time-of-use meter (normally a few hundred dollars). We have assumed the cost for this is part of the 'Estimated Installation cost' shown above. |
Net-Metering: With Net-Metering. surplus electricity generated by your renewable energy system will be credited back to your utility account. So if your solar system makes more electricity than you are using, the 'meter spins backwards'. You are not actually 'selling' electricity, since in most states the utility will not reimburse you for excess electricity. But, if your utility offers 'Net-Metering' you may be able to get credit for electricity provided back to the grid during peak periods. Combined with TOU metering, Net-Metering can result in multiplied savings since your electricity account may be gaining electricity credits during the time of peak utility rates -Think of a hot, sunny summer day ... your solar system is producing power, spinning your electric meter backwards, and supplying the grid with electricity to run other people's air conditioners -you're 'spinning back' cost at peak rates! That's the savings power of Net-metering, combined with TOU rates. |
Solar Power 'Fixes' Energy Costs: The cost of sunshine is free. While the sun rises every morning, the cost of sunshine does not. Utility rates, on the other hand, tend to rise steadily in cost. So, the value of your savings from a solar system are likely to increase as time goes on. If you are on a fixed income (e.g. nearing or in retirement) this may be of particular interest to you. |
THE COST TO GO SOLAR |
This is only an estimate based upon many assumptions and limited data entered by you: Installation costs can vary considerably. The cost to purchase and install a complete grid-tied solar photovoltaic (PV) system on a residential home is typically as further defined in the table, below. This includes the PV array, inverter and associated balance of system costs. It does not include the cost of options you may select, such as battery backup power storage, or the costs of building preparation work, like new shingles. Costs can also be higher if you add other features or have special installation needs (such as application over tile roofing) or you choose to use special mounting systems (such as sun tracking systems). Other factors may also affect price, including, but not limited to, your location, the building condition, type and location, its wiring, and warranties offered. |
|
OTHER ASSUMPTIONS |
This summary is based upon many assumptions and the limited data we have. An actual site assessment by a qualified solar system retailer or contractor will be needed to determine the actual costs and benefits of installing a solar electric system. |